
On July 11, 2019, a driver struck two pedestrians in Jacksonville, Florida, killing one on impact and injuring the other. The driver had been under the influence and was doing 75 mph in a 25 mph zone.
On April 17, 2019, a vehicle struck and killed a pedestrian in front of a San Antonio elementary school. That part of the road was described as dark and unlit.
Pedestrian-related crashes and deaths have been on a rise in the United States. The Jacksonville, Florida crash was just one of the 24,392 crashes and 24,734 pedestrian deaths from 2016-2019.
During the pandemic, there was a significant reduction in traffic during the pandemic, and yet, the pedestrian death rate increased by 20 percent from 2019 to 2020 – the most since 1975.
We analyzed fatal crash data from the National Highway Traffic Safety Administration, focusing on all crashes that involved the deaths of one or more pedestrians from 2016-2019. This translates to:
- 6,098 crashes per year on average
- 16.69 crashes per day
- One crash every 1.4 hours
However, our data shows that the risk of a pedestrian crash increases depending on the time of the year. During the fall months – the deadliest time of the year –a pedestrian-related fatal crash occurs every 1.2 hours.
The Deadliest Time of the Year for Pedestrians
During 2016-2019, nearly a third of all pedestrian crashes (29 percent) occurred during the fall months of the year. The data shows that October is the most dangerous month for pedestrians, followed by November and December. In the fall months, days are beginning to get shorter and darker – reducing visibility on the road and leaving pedestrians more vulnerable. More pedestrians are on the streets during the darker hours of the day, increasing their crash risk.
Percentages of pedestrian crashes by season:
- Spring – 22 percent
- Summer – 22 percent
- Winter – 27 percent
- Fall – 29 percent
Interestingly, the summer months – also known as the “100 deadliest days of the year” – exhibit more risk for motor vehicle crashes involving teenage drivers, but are safer for pedestrians. Crashes peaked in October (2,525), and they were at their lowest in June (1,612).
Pedestrian crashes by month:
| Month | Crashes | Percent of Total |
|---|---|---|
| January | 2,174 | 8.9 percent |
| February | 1,956 | 8 percent |
| March | 1899 | 7.8 percent |
| April | 1,662 | 6.8 percent |
| May | 1,735 | 7.1 percent |
| June | 1,612 | 6.6 percent |
| July | 1,732 | 7.1 percent |
| August | 1,953 | 8 percent |
| September | 2,149 | 8.8 percent |
| October | 2,525 | 10.4 percent |
| November | 2,502 | 10.3 percent |
| December | 2,493 | 10.2 percent |
The Deadliest Days of the Year for Pedestrians
To find the ‘deadliest day’ nationwide, we analyzed the average number of crashes where more than one pedestrian was killed across the study period. As previously observed, the top five deadliest days are aligned with the fall months of the year – between October and November. October 28 is the deadliest day of the year for pedestrians across the United States.
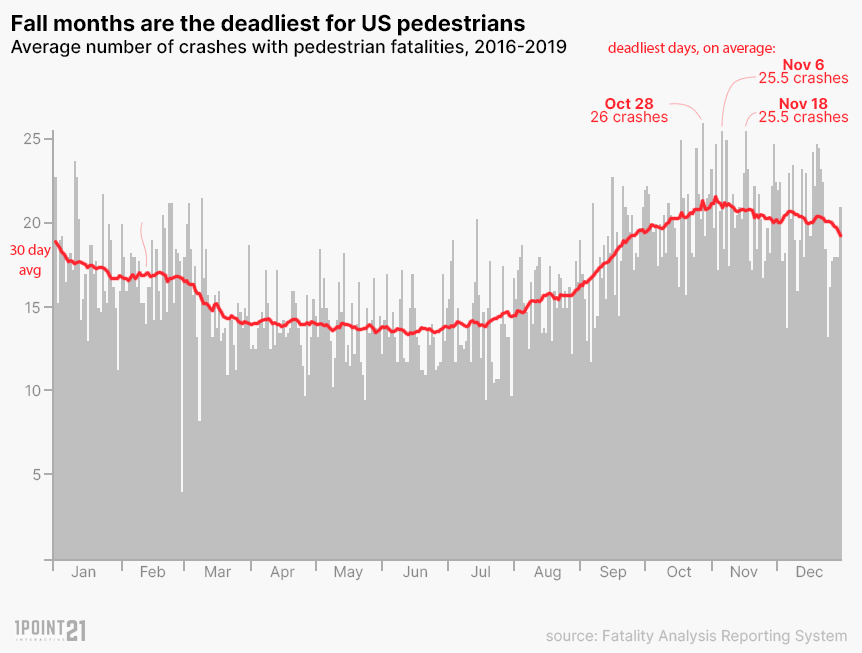
The deadliest days on average for pedestrians nationwide:
- October 28 – 26 average crashes
- November 6 – 25.5 average crashes
- November 18 – 25.5 average crashes
- October 18 – 25 average crashes
- November 8 – 25 average crashes
In addition, we identified individual days during specific years with the highest number of pedestrian crashes. This data also reflects that aside from August 20th, all the most dangerous days occur in the fall.
The individual deadliest days for pedestrians:
- October 19, 2018 – 35 crashes, 35 deaths
- November 30, 2018 – 35 crashes, 35 deaths
- August 20, 2016 – 34 crashes, 37 deaths
- November 3, 2016 – 33 crashes, 35 deaths
- November 17, 2017 – 33 crashes, 33 deaths
- December 21, 2018 – 33 crashes, 33 deaths
Holidays
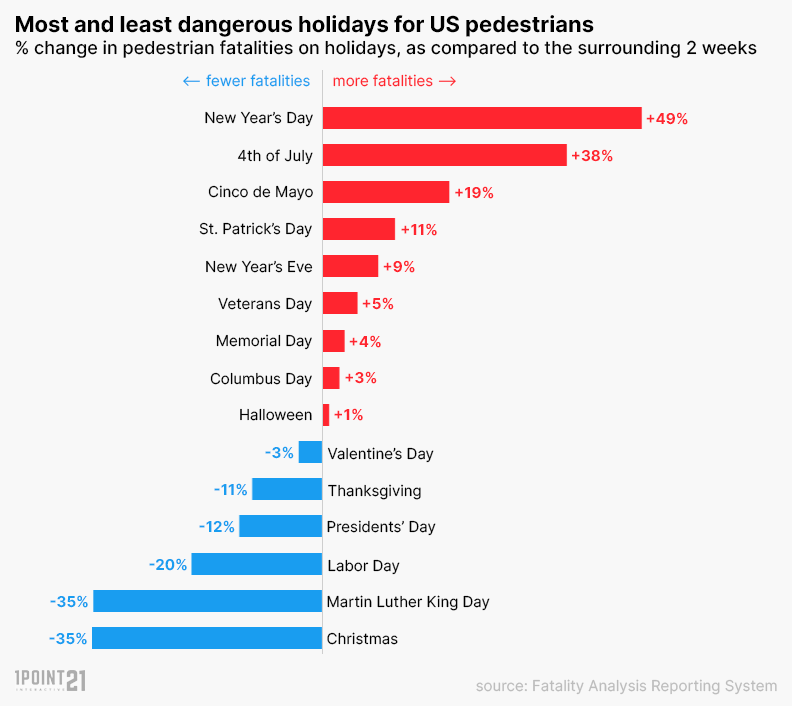
In order to identify whether there were any spikes during the holidays, we compared the average number of crashes on the holiday to the two weeks surrounding the holiday. The largest spike in pedestrian crashes is seen on New Year’s Day, followed by the Fourth of July and Cinco de Mayo. Surprisingly, there was not any significant increase on Halloween. Thanksgiving and Christmas also show a dip as families celebrate the holidays indoors.
Where Are Pedestrians at Highest Risk?
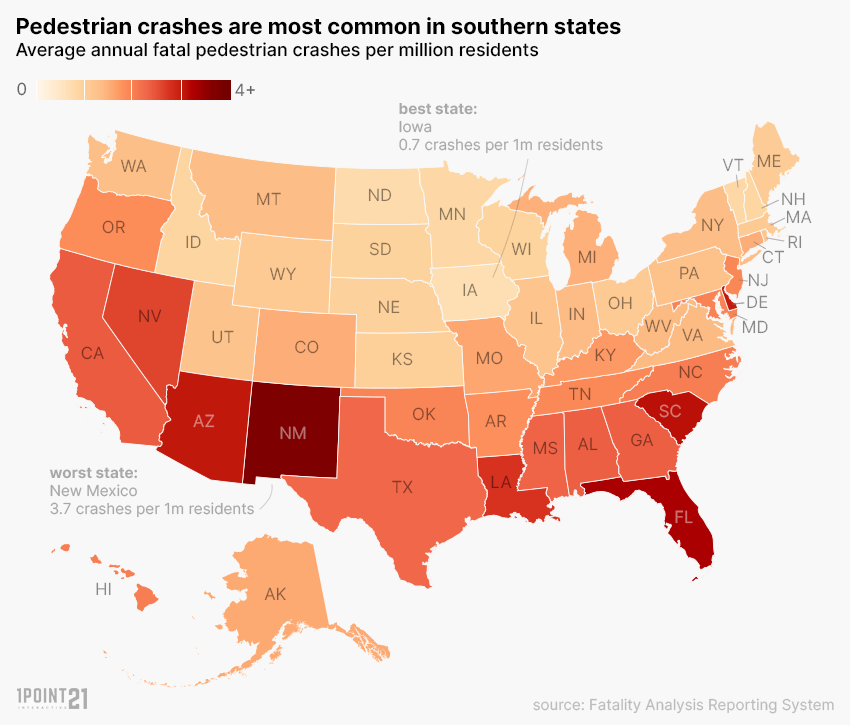
In general, pedestrian fatal crashes are most common in southern or southwestern states. New Mexico had the highest number of pedestrian crashes – 3.7 crashes per one million residents.
| Rank | State | Avg Fatal Ped Crashes per 1M Residents |
|---|---|---|
| 1 | New Mexico | 3.72 |
| 2 | Florida | 3.31 |
| 3 | South Carolina | 3.13 |
| 4 | Arizona | 3.06 |
| 5 | Delaware | 3.04 |
| 6 | Louisiana | 2.77 |
| 7 | Nevada | 2.62 |
| 8 | California | 2.41 |
| 9 | Georgia | 2.37 |
| 9 | Alabama | 2.37 |
| 11 | Mississippi | 2.32 |
| 12 | Texas | 2.28 |
| 13 | North Carolina | 2.04 |
| 13 | Hawaii | 2.04 |
| 15 | Maryland | 1.97 |
| 16 | Oklahoma | 1.96 |
| 17 | New Jersey | 1.91 |
| 18 | Tennessee | 1.9 |
| 19 | Oregon | 1.86 |
| 20 | Arkansas | 1.83 |
| 21 | Kentucky | 1.73 |
| 22 | Missouri | 1.6 |
| 23 | Alaska | 1.57 |
| 24 | Connecticut | 1.52 |
| 24 | Colorado | 1.52 |
| 26 | Michigan | 1.5 |
| 27 | Virginia | 1.39 |
| 28 | West Virginia | 1.38 |
| 29 | Indiana | 1.36 |
| 29 | New York | 1.36 |
| 29 | Montana | 1.36 |
| 32 | Washington | 1.32 |
| 33 | Pennsylvania | 1.28 |
| 34 | Utah | 1.24 |
| 35 | Illinois | 1.23 |
| 36 | Rhode Island | 1.18 |
| 37 | Wyoming | 1.11 |
| 37 | Ohio | 1.11 |
| 37 | Massachusetts | 1.1 |
| 40 | Maine | 1.09 |
| 41 | Kansas | 1 |
| 42 | Nebraska | 0.98 |
| 43 | South Dakota | 0.95 |
| 44 | Wisconsin | 0.93 |
| 45 | Idaho | 0.91 |
| 46 | New Hampshire | 0.88 |
| 47 | Vermont | 0.84 |
| 48 | Minnesota | 0.83 |
| 49 | North Dakota | 0.76 |
| 50 | Iowa | 0.7 |
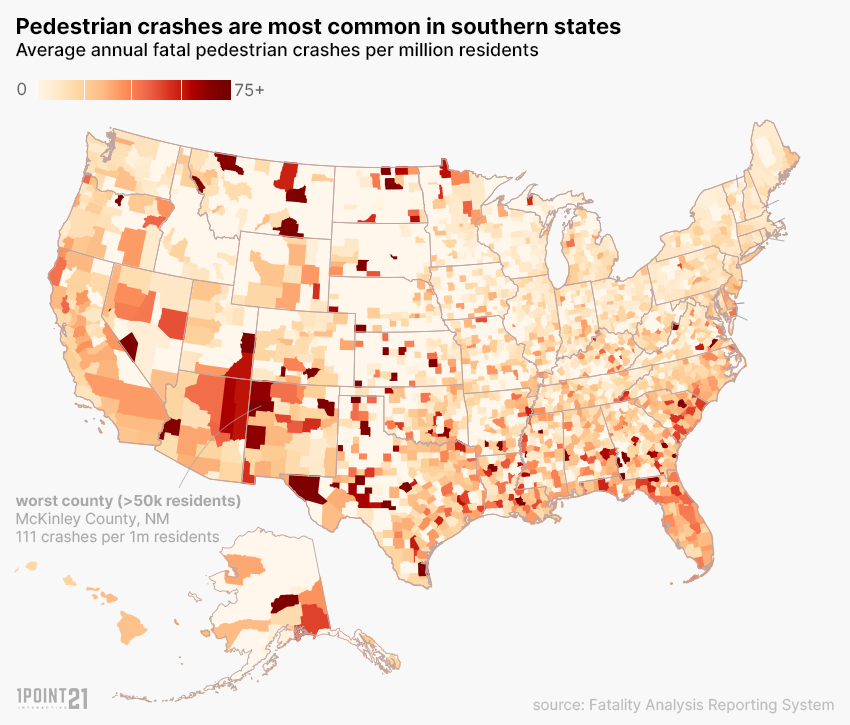
At the county level, New Mexico’s McKinley County and San Juan County had the highest average of fatal pedestrian crashes – 111 crashes and 72 crashes per one million residents, respectively. San Antonio’s Bexar County in Texas consisted of less than half of that (31 crashes per one million residents).
The worst cities for fatal pedestrian crashes tend to be in areas with warmer climates – such as Florida and California – that allow for year-round outdoor activities. Other contributing factors are higher populations and the tourism industry.
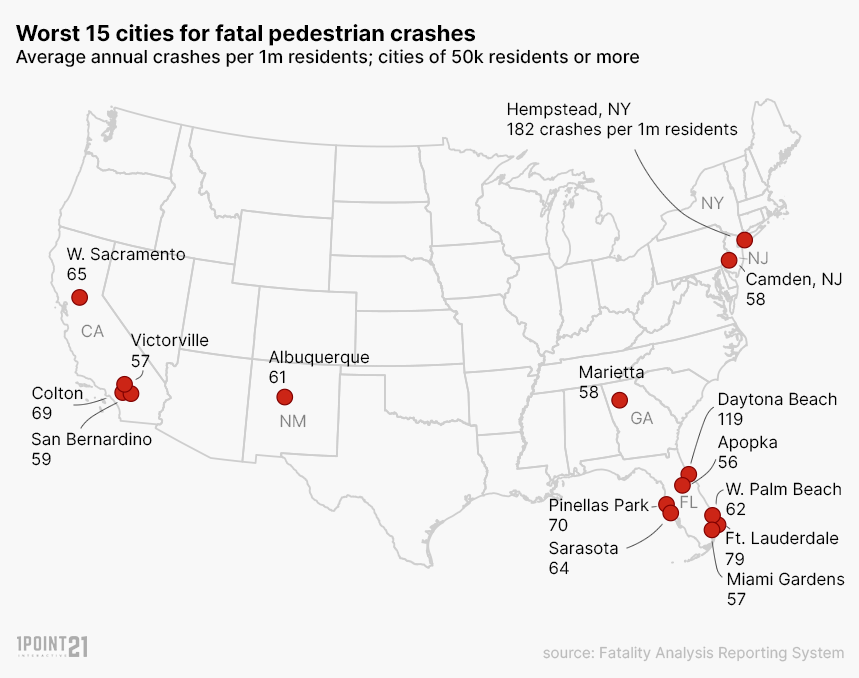
Nearly half of the worst cities for fatal pedestrian crashes were located in Florida. Florida’s Daytona Beach and Fort Lauderdale had the most crashes per one million residents, after New York’s Hempstead. Hempstead’s Turnpike has been considered Long Island’s most dangerous road for pedestrians since 2008, due to the long distances between crosswalks and poor visibility.
| Rank | City | State | Crashes per 1 million Residents |
|---|---|---|---|
| 1 | Hempstead | NY | 181.56 |
| 2 | Daytona Beach | FL | 119.12 |
| 3 | Fort Lauderdale | FL | 79.26 |
| 4 | Pinellas Park | FL | 69.87 |
| 5 | Colton | CA | 68.92 |
| 6 | West Sacramento | CA | 65.12 |
| 7 | Sarasota | FL | 64.17 |
| 8 | West Palm Beach | FL | 62.48 |
| 9 | Albuquerque | NM | 60.63 |
| 10 | San Bernardino | CA | 58.83 |
| 11 | Camden | NJ | 57.76 |
| 12 | Marietta | GA | 57.56 |
| 13 | Miami Gardens | FL | 56.93 |
| 14 | Victorville | CA | 56.85 |
| 15 | Apopka | FL | 55.99 |
The Five Most Dangerous Cities for Pedestrians (with 500k + pop.)
Surprisingly, Seattle, Washington D.C., and New York were among the safest big cities for pedestrians, as opposed to Albuquerque, which is the most dangerous. The number of crashes per million residents in Albuquerque is nearly five times that in Seattle. Phoenix and Tuscon also ranked in the top five most dangerous cities, and Arizona has had the dubious reputation of being in the top ten pedestrian death rates since 1994.
| Rank | City | State | Crashes per 1million Residents |
|---|---|---|---|
| 1 | Albuquerque | NM | 60.62919 |
| 2 | Phoenix | AZ | 54.36937 |
| 3 | Memphis | TN | 49.53932 |
| 4 | Tucson | AZ | 45.54058 |
| 5 | Detroit | MI | 44.00082 |
The Five Safest Cities for Pedestrians (with 500k + pop.)
Seattle is the safest city for pedestrians in the U.S., with just a little over 12 crashes per one million residents. All of these cities have prioritized pedestrian safety and are working proactively to improve it.
| Rank | City | State | Crashes per 1million Residents |
|---|---|---|---|
| 1 | Seattle | WA | 12.61133 |
| 2 | Washington, Dc | DC | 13.41329 |
| 3 | New York New York | NY | 13.78413 |
| 4 | Boston | MA | 14.7554 |
| 5 | Chicago | IL | 16.71932 |
There are several factors that impact road safety – one is road design. Are the roads and streets designed with pedestrian and bicyclist safety in mind? For example, the Washington D.C. Department of Transportation has prioritized pedestrian and bicyclist safety by adding new LED lights to increase street visibility and new programs to improve the safe flow of city-wide vehicles, pedestrians, and bicycles. Boston has installed traffic-monitoring cameras, posted public safety signs, and implemented other strategies for preventing pedestrian crashes. The risk of fatal pedestrian crashes in New Mexico could be higher due to the size of vehicles – pickup trucks are a popular choice. Studies cite city population and cell phone use as other contributing factors, but steps taken by Boston and Washington D.C. may have mitigated some risk.
Pedestrian Safety Tips
As a pedestrian, your safety is a priority – always. While you cannot predict drivers on the road, practice ‘defensive walking’ through the following three tips recommended by our San Antonio personal injury lawyers:
- Make sure you are visible and do not assume the driver has seen you. Knowing that pedestrian crashes increase during the fall months of the year and darker hours of the day can help you take necessary precautions.
- Don’t multitask when crossing the street; so many crashes are caused by either a distracted driver or a distracted pedestrian. Set aside your phone and give your full attention to the road.
- Use the crosswalks or pedestrian-friendly routes, rather than putting yourself at a higher risk. Be predictable and safe over saving time.
Fair Use
If you would like to report or republish our findings, please link to this page to provide a citation for our work.